The north shore bluffs of Lévis, carved by the St. Lawrence River, hide a complex stratigraphy of Cambrian-Ordovician sedimentary rock overlain by glacial till and sensitive marine clays. In our experience running geophysical surveys along the Trans-Canada corridor, what you see at surface here rarely matches what lies at depth. Seismic tomography cuts through that uncertainty. It images the subsurface velocity structure without drilling a single borehole, mapping the contact between overburden and the fractured shale bedrock that dominates Lévis geology. For projects near the riverbank or on the sloping terrain of the old city, knowing exactly where competent rock begins is the difference between a straightforward foundation and costly over-excavation. We deploy this method regularly across the Chaudière-Appalaches region, often pairing it with an in-situ permeability test when groundwater flow through fractured rock becomes a design concern for deep excavations.
A velocity jump from 500 m/s to over 2,500 m/s marks the bedrock surface with a clarity no probe can match.
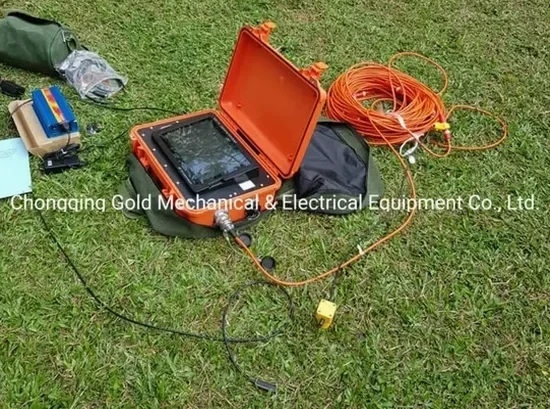
Process and scope
The field setup for a seismic refraction profile in Lévis adapts to the terrain, whether we are working along a level municipal lot near the Desjardins complex or on a wooded slope above the river. We lay out a 24- or 48-channel geophone spread with spacing tight enough to resolve thin layers of till that often sit just above the bedrock surface. The energy source varies by site conditions: a 12 kg sledgehammer on a steel plate for shallow targets under 20 meters, or a weight drop system for deeper penetration where bedrock dips below 30 or 40 meters. Our acquisition system samples at 0.25 ms intervals, giving us the temporal resolution needed to pick first arrivals accurately even through the noisy background of a working city. Data processing runs through tomographic inversion codes that iterate until the velocity model fits observed travel times within a fraction of a millisecond. The final output is a 2D cross-section showing p-wave velocity as a color gradient, where soft clay registers around 400-800 m/s and competent shale jumps above 2,500 m/s. That contrast is unmistakable, and it tells the geotechnical engineer exactly where to stop digging.
Local ground factors
Lévis sits in a moderate seismic hazard zone: NBCC 2020 assigns a peak ground acceleration of roughly 0.15g for the 2% in 50-year probability level on the south shore. On top of that, the marine clay layers that underlie much of the lower city amplify ground motion, potentially pushing site class from C to D or even E depending on thickness and shear wave velocity. Skipping a seismic velocity survey in this context is engineering negligence. If you classify a site as Class C based on a few SPT blows when a 12-meter clay pocket drops the average Vs below 180 m/s, you are designing to the wrong spectral accelerations. We have seen this happen on projects around the Saint-Nicolas industrial park, where infill and natural sediments create highly variable profiles. Seismic tomography provides the continuous velocity data needed to compute a defensible Vs30 value, and the cross-sections often reveal buried channels or paleo-scarps that borehole-only investigations miss entirely.
Frequently asked questions
How deep can seismic refraction see in the Lévis area?
With a sledgehammer source and a 48-channel spread, we routinely image to 25-35 meters depth in the glacial till and clay overburden typical of Lévis. For deeper targets, we switch to a weight drop or accelerated weight drop system, which can push the investigation depth to 60-100 meters depending on the velocity contrast at the bedrock interface. The limiting factor is usually the signal-to-noise ratio more than the energy source, especially along busy corridors like Route 132 or near railway lines.
Can seismic tomography work on paved surfaces or inside existing buildings?
Yes, with some limitations. On asphalt or concrete, we use base-mounted geophones with a coupling gel or a thin sand layer, and the energy source is typically a sledgehammer on a metal plate. The data quality is slightly reduced compared to soil coupling, but still usable for bedrock mapping. Inside buildings, the challenge is space for the geophone spread and the noise from machinery, but we have done this successfully in warehouse floors and industrial plants around the Saint-Romuald area.
What is the typical cost range for a seismic refraction survey in Lévis?
For a standard 2D refraction profile of 115 to 230 linear meters with interpretation and a signed engineering report, budget between CA$3,780 and CA$8,160 depending on the number of shots, the access conditions, and the depth of investigation required. A full Vs30 site classification with MASW plus refraction on a typical commercial lot generally falls in the upper half of that range. We provide a fixed-price proposal after a site walk.
How do you verify that the seismic velocities actually match the real ground conditions?
We calibrate every seismic model against at least one borehole or test pit whenever possible. The velocity boundaries in the tomogram are compared to the logged stratigraphy, and we adjust the interpretation accordingly. In the shale bedrock of Lévis, the transition from weathered to competent rock shows a velocity increase from around 1,800 m/s to over 2,800 m/s, and this matches the RQD improvement seen in core samples. The correlation is well documented in the geophysical literature and in our own project database for the Quebec City-Lévis corridor.